Save time and money debugging TI processes more effectively and efficiently!
The “TurboDebugger.bat” TI process DOS version of a debugger has finally been replaced by the new IBM Planning Analytics Workspace (PAW) debugger. The first release of the new functionality is included in PAW version 2.084 releases and above. In this article we will dive into the features of the new TI Process Debugger within PAW and how it can help you troubleshoot issues faster in your Turbo Integrator processes.
Enable the TI Process Debugger:
The TI process debug mode can be enabled within PAW Workbench while editing any process. In the top right corner of the process window, the debug button is on the far-right corner of the menu bar. Click this button to display the debug window.
After clicking the debug button, the debug window will display.
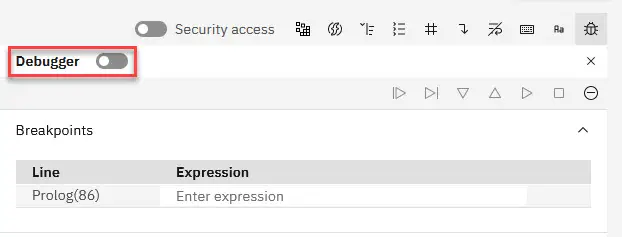
To turn the process debugger on click on the Debugger toggle switch highlighted above. Once the debugger is enabled this changes the “Run” button above the debugger button into the “Debug” button.

Debug Mode – Process Execution
Before running the process in debug mode, set any breakpoints in the process where you want to pause the process to see the variable definitions.

Click the Debug button and define any process parameters required for the TI process.
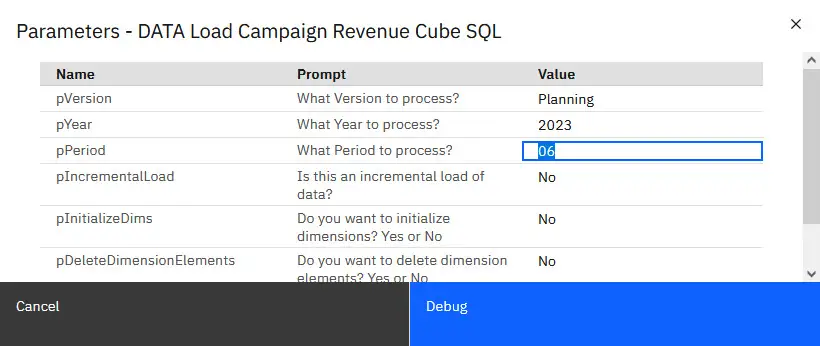
Click the Debug button and define any process parameters required for the TI process.
Debugger Window
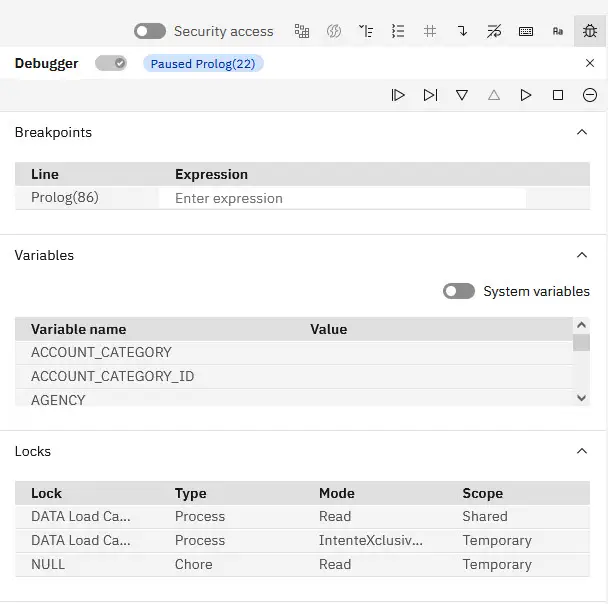

Debugger Toolbar
Continue – button runs through process until it reaches the next breakpoint.
Step over – button will execute current highlighted line of the process. This will allow you to execute a process line-by-line and will execute a line of code that executes a process normally.
Step in – button is like “Step Over” but running a line of code that executes a process will open sub process in debug mode to continue debugging in that process.
Step out – button is only used after “Step In” to enter debug mode in a sub process, “Step Out” will finish the execution of the sub process and return to debugging the original process that called it.
Continue to end – button will continue execution of the TI process and ignore any breakpoints.
Stop execution – button will immediately end the execution of the TI process debugging.
Remove all breakpoints – button removes all breakpoints from the TI process.
Breakpoints
The TI process debugger allows you to select any line of code to pause before executing the line of code.
- Conditional Breakpoints
You can set a conditional breakpoint by entering expressions. The expression must evaluate to true or false and can contain references to any variables, parameters and use TI process functions. Potential expression errors can be corrected at run time.
To enter the expression, click the Expression field for the selected breakpoint, and type the expression.
In the following example, the expression pPeriod@='01' is entered for the line Prolog(86) breakpoint to stop debugging when the input data is for period ‘06’.

Variables
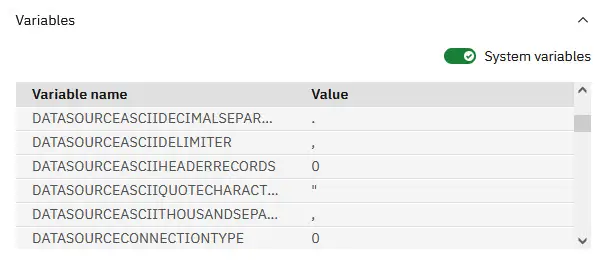
When the debugger pauses, the Variables section shows the current process variables and their values.
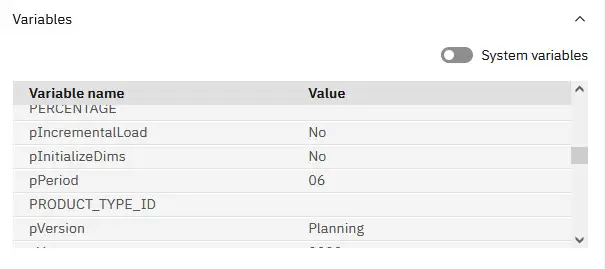
· System Variables
Select the “System variables” toggle button to show the TI process system variables.
Locks
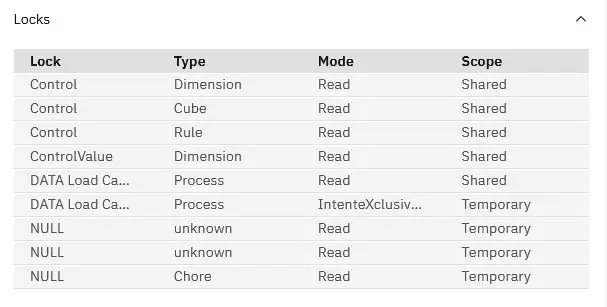
The debugger provides a window to display lock information during the process execution in debug mode. This provides useful information to determine potential lock contention during the execution of the process.
The new IBM Planning Analytics Workspace Turbo Integrator process debugger allows developers to debug with the process now versus creating log files with ASCIIOUTPUT functions and analyze and hope you define all the outputs needed to troubleshoot. Developers will become more efficient troubleshooting and resolving problems now once they learn how to properly use the debugger.

