
How a leading pet care company connected its financial plan to $180M in trade spending — giving the CFO a real gross-to-net P&L and the sales team promotion ROI they could actually act on.
The Client
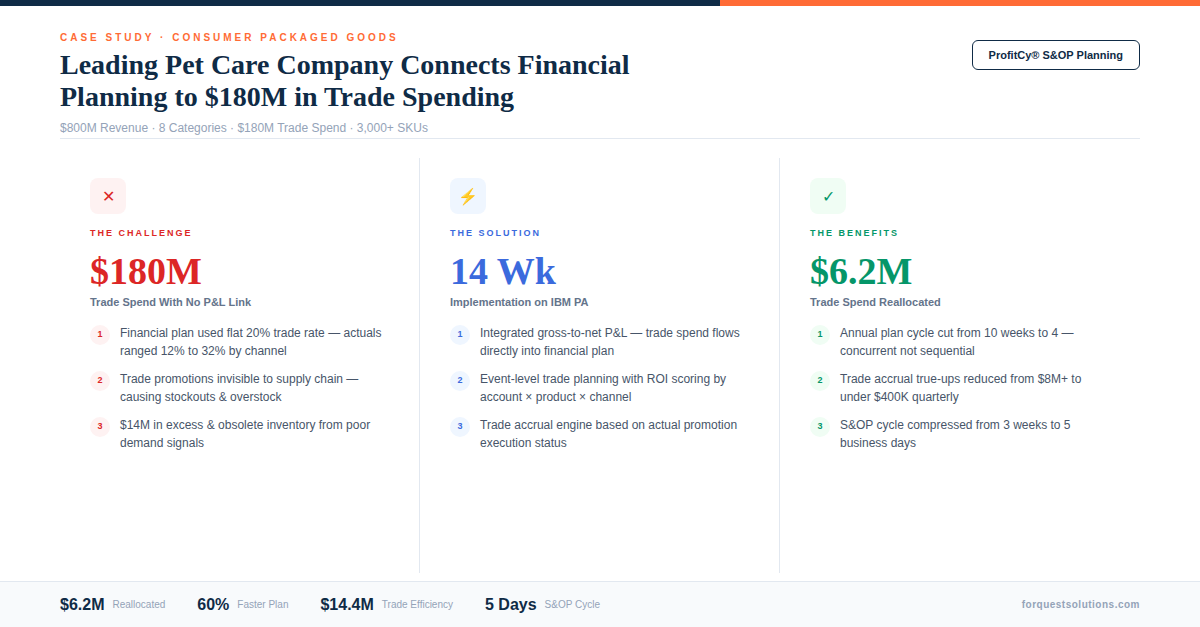
A leading pet care company with annual revenue exceeding $800M across 8 product categories including flea & tick treatments, pet nutrition, grooming, and accessories. The company manages 3,000+ SKUs distributed through grocery, mass, pet specialty, club, and e-commerce channels — with an annual trade spend budget of $180M representing 22% of gross revenue.
The Challenge: Two Planning Worlds That Never Connected
The company ran two completely separate planning processes: Finance owned the P&L plan in one set of spreadsheets; Sales owned trade spend planning in another. The two never connected — which meant the CFO’s financial plan used a flat trade rate assumption while Sales committed $180M in actual promotions that didn’t match.
The consequences were severe and compounding:
- Financial plan disconnected from trade reality — the annual P&L budget used a blended 20% trade rate assumption across all channels. Actual trade rates ranged from 12% in e-commerce to 32% in grocery. The financial plan was wrong before the year even started
- 10-week annual plan cycle — Finance, Sales, and Marketing each built their plans sequentially. Finance set revenue targets in August, Sales built promotion calendars in September, and Marketing layered in brand spending in October. The final consolidated plan wasn’t approved until mid-November — 6 weeks before the fiscal year started
- No gross-to-net visibility — the P&L showed net revenue, but nobody could decompose it into gross revenue minus trade spend minus returns minus slotting by channel, customer, or brand. The CFO couldn’t explain why net revenue missed when gross shipments were on plan
- Trade spend planned by region, not by ROI — 6 regional sales directors each managed their own promotion budgets in Excel with no standardized event templates, no ROI measurement, and no post-event analysis. $180M was allocated by historical precedent, not performance
- Forecast disconnected from actuals — the monthly forecast process took 3 weeks because Finance manually collected trade spend actuals from Sales, reconciled them against the financial plan, and adjusted the remaining quarters. By the time the forecast was done, it was already stale
- Accruals consistently wrong — trade spend accruals were based on the original budget, not actual promotion execution. The gap between accrued and actual trade spend created $8M+ in quarterly true-ups that the audit committee flagged as a material weakness risk
The CFO put it bluntly: “We budget $180 million in trade spend and we can’t tell you whether it’s working, where it’s going, or how it affects the bottom line.”
The Solution: ProfitCy® Financial Planning & Trade Spend on IBM Planning Analytics
ForQuest deployed ProfitCy® with two integrated modules — Financial Planning and Trade Spend Management — on IBM Planning Analytics. The critical design principle: one model where the trade spend plan flows directly into the financial plan with full gross-to-net reconciliation.
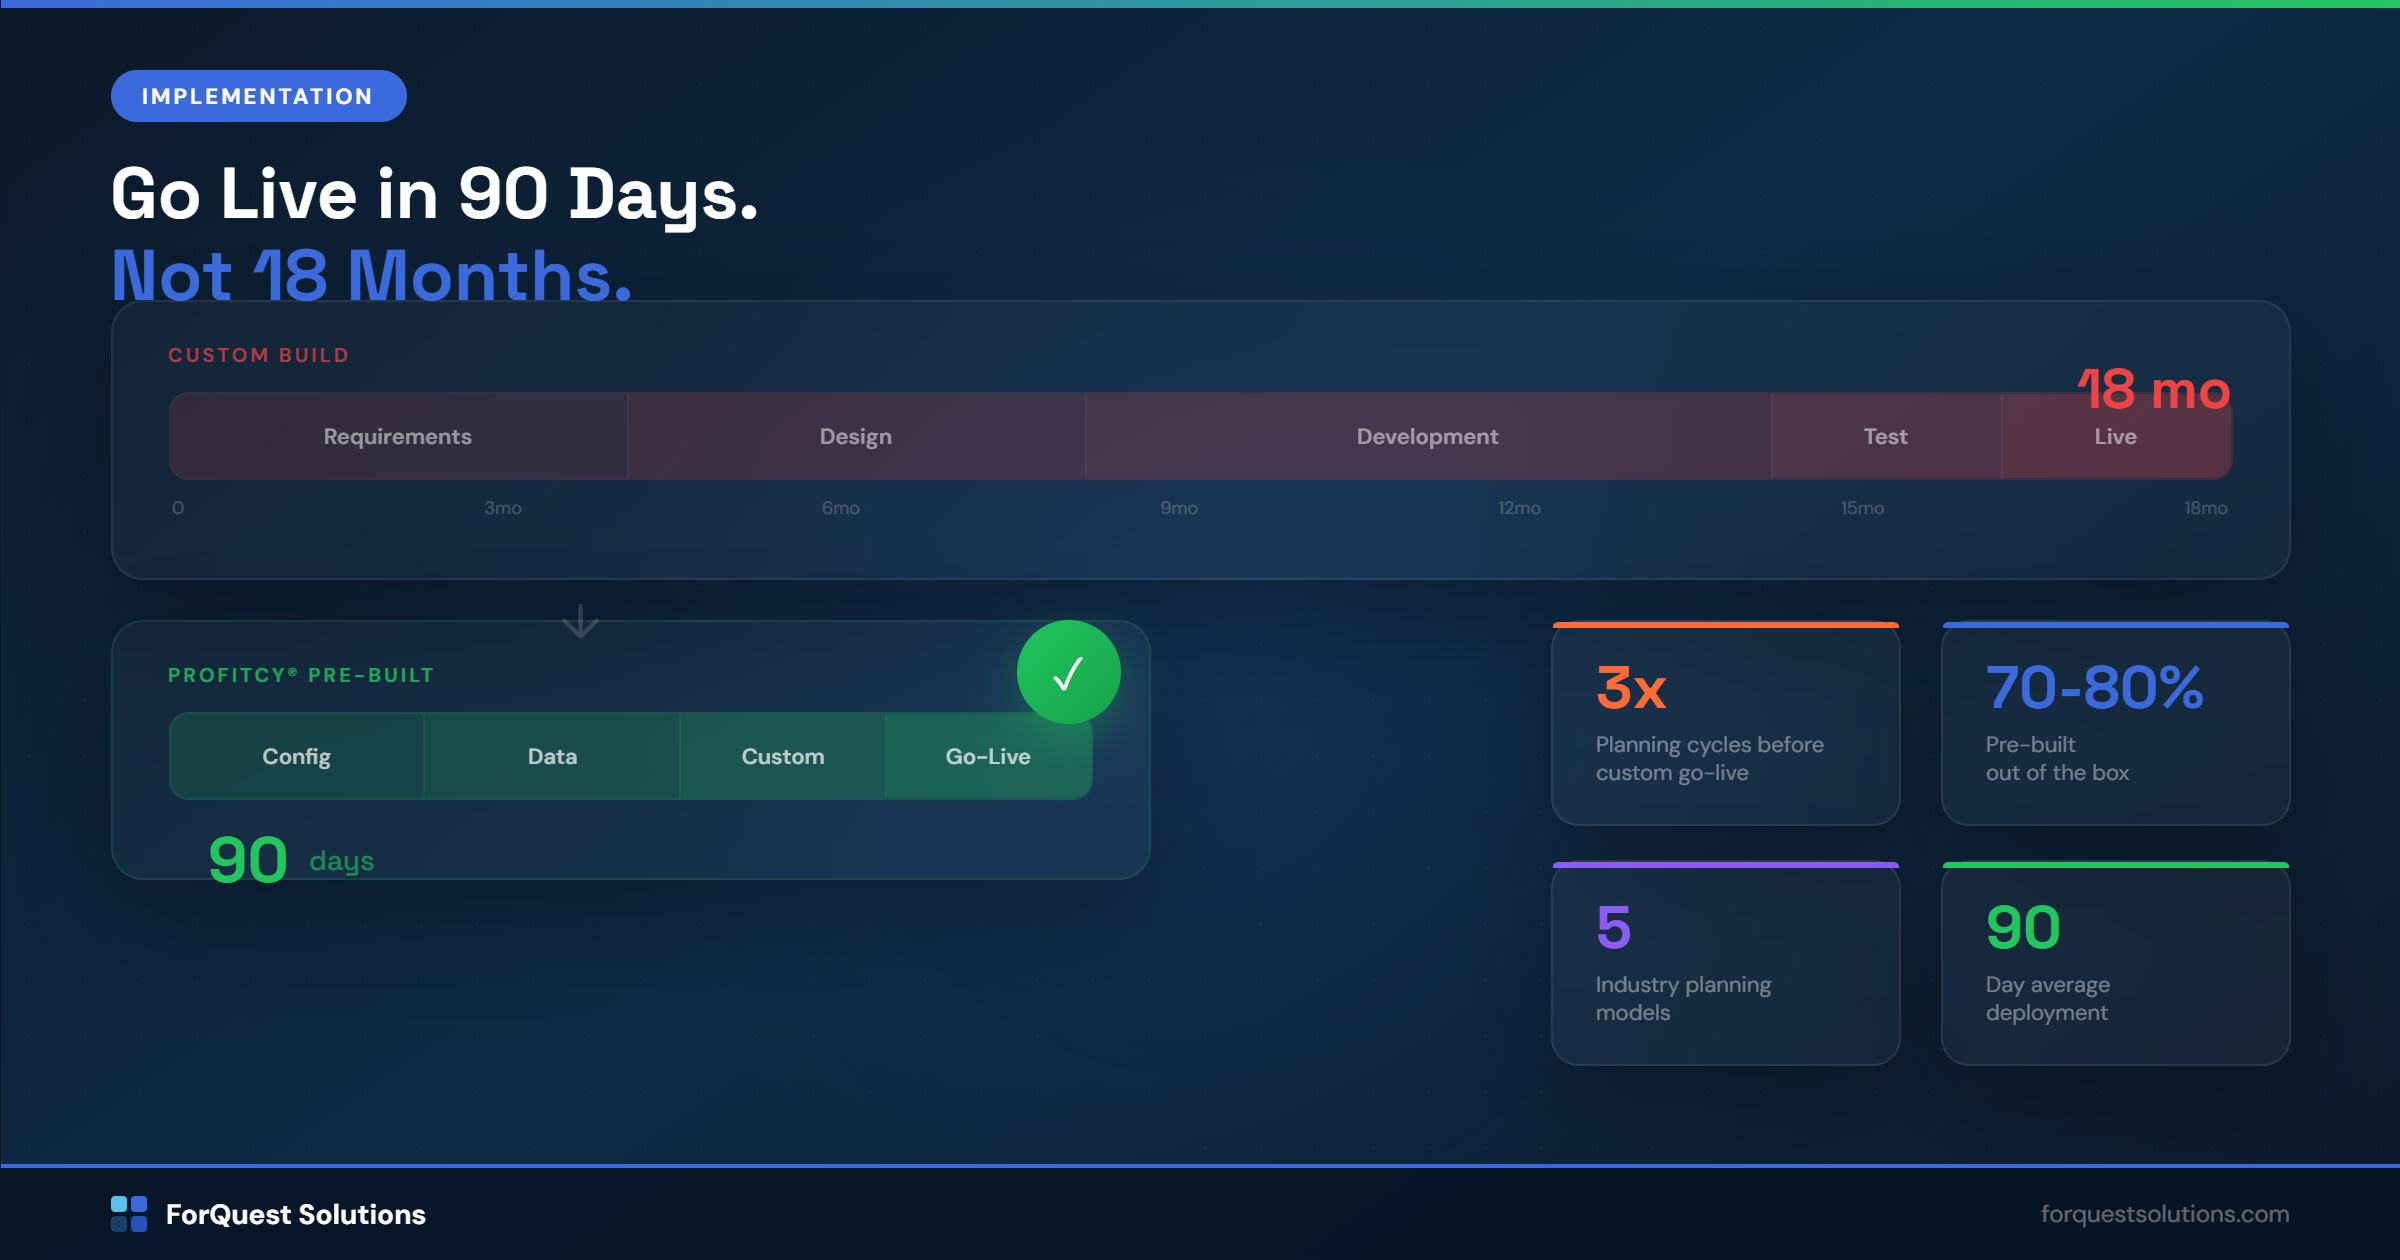
The implementation took 14 weeks from kickoff to production.
What ForQuest built:
- Integrated gross-to-net P&L that starts with gross revenue by channel × brand × customer tier and flows through trade spend, returns, slotting fees, and allowances to arrive at net revenue — with every deduction category plannable and trackable separately
- Trade spend planning by event with standardized promotion templates across all 6 regions. Each event captures promotion type, timing, volume lift assumption, funding source, and expected ROI. The trade plan rolls up to the financial plan automatically — eliminating the disconnect between what Sales commits and what Finance budgets
- Channel-level trade rate planning replacing the flat 20% blended assumption with actual trade rate targets by channel (grocery 28-32%, mass 22-26%, club 18-22%, pet specialty 14-18%, e-commerce 10-14%). Finance and Sales now plan to the same trade rates
- Monthly rolling forecast with trade integration — actuals from the trade management system feed into TM1 via TurboIntegrator. The forecast automatically adjusts remaining trade spend, net revenue, and margin based on actual promotion execution — no more 3-week manual reconciliation
- Trade accrual engine that calculates monthly accruals based on actual promotion execution status rather than original budget. Each promotion carries a status (planned, committed, executed, settled) and the accrual adjusts accordingly — eliminating the quarterly true-up surprises
- Trade ROI analytics calculating incremental volume, incremental revenue, trade spend, and ROI at the event × account × product level. Category managers can see which promotions are driving profitable volume and which are subsidizing baseline
- PAXcel™ dashboards giving Finance the gross-to-net bridge in Excel, Sales the trade spend tracker with ROI by event, and the CFO a consolidated P&L with full trade waterfall — all from the same TM1 model
Why ProfitCy® Made the Difference
The company had previously evaluated a standalone trade promotion management (TPM) tool. The vendor proposed a $1.4M, 12-month implementation — but the tool couldn’t integrate with the financial planning process. It would have created a third planning silo alongside the existing Finance and Sales processes.
ProfitCy® solved this by building trade spend planning natively inside the financial planning model:
- Trade events roll up to the P&L automatically — no integration, no reconciliation, no “Sales says one number, Finance says another”
- Gross-to-net decomposition uses the same chart of accounts and customer/channel hierarchies as the financial plan
- Monthly forecast actuals flow through one TurboIntegrator process that updates both trade and financial views simultaneously
- Accruals calculate from the same promotion data that drives the P&L — because it’s the same model
The Results: Measurable Impact in Two Quarters
10 Weeks → 4 Weeks: Annual Plan Cycle
Finance, Sales, and Marketing now plan concurrently in the same TM1 model instead of sequentially in separate spreadsheets. Revenue targets, trade spend, and brand investment are planned together with real-time visibility into the gross-to-net impact. The plan is board-approved 6 weeks earlier than before.
Gross-to-Net Visibility: First Time Ever
The CFO can now decompose net revenue into gross shipments minus trade discounts, off-invoice allowances, performance incentives, slotting, returns, and cash discounts — by channel, brand, customer tier, and period. When net revenue misses, the team knows within hours whether the gap is volume, price, trade rate, or mix.
Trade ROI: $6.2M Reallocated
The first full quarter of trade ROI analytics revealed that 28% of grocery promotions generated zero incremental volume — customers were buying on deal what they would have bought at full price. The Sales team reallocated $6.2M from zero-lift events to high-performing accounts and new product launch support.
Monthly Forecast: 3 Weeks → 4 Days
The monthly forecast now takes 4 business days. Trade actuals feed automatically from the trade management system. Finance reviews exceptions and adjusts the outlook rather than spending 3 weeks manually reconciling Sales and Finance data.
Trade Accruals: $8M Quarterly True-Ups Eliminated
The event-level accrual engine reduced quarterly trade accrual true-ups from $8M+ to under $400K. The audit committee removed the material weakness flag. Monthly accruals now reflect actual promotion execution status rather than static budget assumptions.
Channel Trade Rates: Planned and Tracked
Finance and Sales now plan to the same channel-level trade rates. Actual trade rates are tracked monthly against plan with variance analysis by channel, brand, and customer tier. The blended trade rate dropped from 24.1% to 22.3% in the first year — representing $14.4M in improved gross-to-net efficiency.
The Client’s Perspective
“For the first time, my financial plan and my trade plan are the same plan. I don’t have to reconcile two different versions of reality anymore. When the board asks why net revenue moved, I can show them the exact gross-to-net bridge in real time.”
— Chief Financial Officer
Technology Stack
- Platform: IBM Planning Analytics (TM1)
- Planning Model: ProfitCy® Financial Planning + Trade Spend Management
- Excel Connectivity: PAXcel™ Web Add-In
- Data Integration: TurboIntegrator (ERP, trade management system, syndicated POS data)
- Dashboards: Planning Analytics Workspace (PAW)
- Implementation Timeline: 14 weeks
Is Your Financial Plan Disconnected from Trade Spending?
If your CFO sees one number and your Sales team sees another, ForQuest can help. ProfitCy® connects financial planning to trade spend management in one IBM Planning Analytics model — with full gross-to-net visibility.