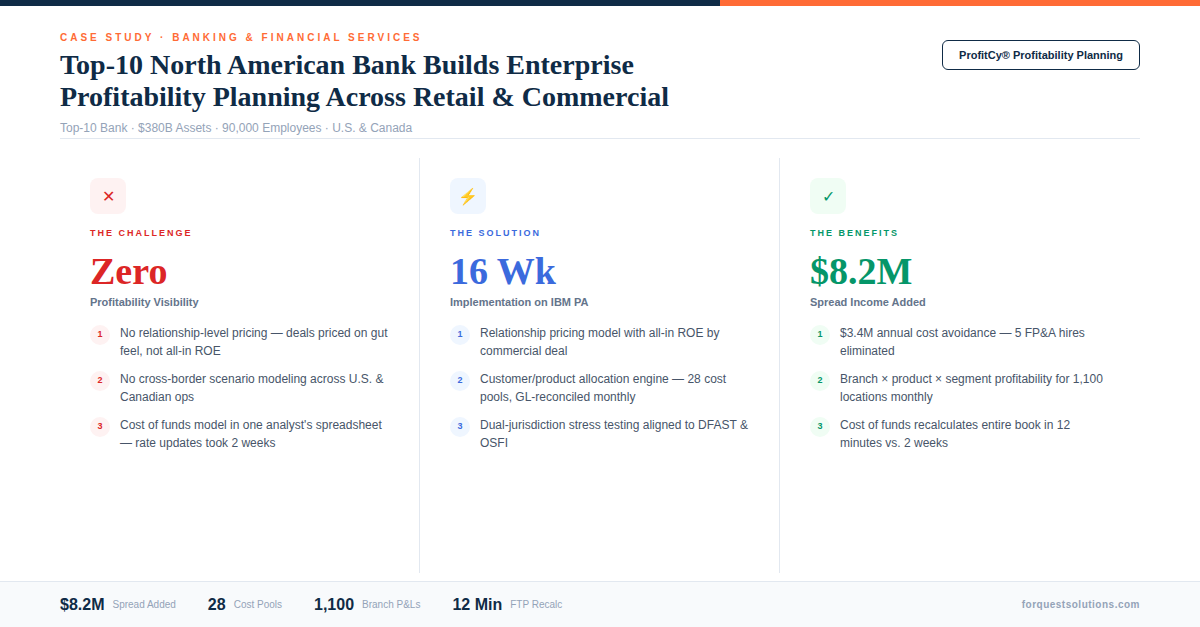

How a top-10 North American bank built a single profitability planning platform across retail and commercial banking — with relationship pricing, cost of funds, and customer-level allocations for 1,100 branches.
The Client
A top-10 North American bank with $380 billion in assets, over 1,100 retail branch locations across the U.S. and Canada, and more than 90,000 employees. The bank operates retail banking, commercial banking, wealth management, and insurance divisions — each with its own profitability reporting process, allocation methodology, and pricing framework.
The Challenge: Profitability Was a Black Box
The bank had no unified view of profitability. Retail and commercial banking each measured profitability differently, using different allocation methodologies, different cost of funds assumptions, and different customer segmentation hierarchies. The CFO couldn’t answer a fundamental question: “Which customers, products, and branches are actually making us money?”
The problems were structural:
- No relationship pricing visibility — commercial relationship managers priced deals based on competitive pressure and gut feel, with no real-time view of the all-in cost of a relationship including deposits, loans, treasury management fees, and allocated capital costs
- Customer and product allocations disconnected — indirect costs were allocated using outdated activity-based costing drivers that hadn’t been recalibrated in 4 years. Retail banking absorbed costs that should have been allocated to commercial, and vice versa
- Retail vs. commercial profitability unmeasurable — the two divisions used different GL structures, different cost centers, and different margin calculation methodologies, making consolidated reporting a 3-week manual exercise
- Branch performance opaque — branch-level profitability was calculated quarterly using a 6-week-old snapshot with estimated allocations. Branch managers had no actionable view of what was driving their P&L
- Cost of funds modeled in spreadsheets — the bank’s funds transfer pricing (FTP) model lived in a single analyst’s Excel workbook. When rate environments shifted, updating the matched-maturity transfer pricing curves across all products took 2 weeks
- Regulatory scrutiny — examiners flagged the bank’s inability to demonstrate profitability at the customer and product level as a risk management gap, particularly for commercial lending concentration analysis
The CFO described the situation: “We know our total net income. We don’t know where it comes from.”
The Solution: ProfitCy® Profitability Planning on IBM Planning Analytics
ForQuest deployed ProfitCy® with integrated profitability, allocation, and pricing modules on IBM Planning Analytics — configured for the bank’s dual-division structure, multi-currency requirements, and regulatory reporting needs.
The implementation took 16 weeks from kickoff to production.
What ForQuest built:
- Relationship pricing model for commercial banking that calculates all-in relationship profitability in real time — aggregating loan spreads, deposit margins, fee income, FTP charges, capital allocation costs, expected loss provisions, and operating cost allocations at the relationship level. Relationship managers can now price a new deal and see the impact on total relationship ROE before committing
- Customer and product allocation engine using refreshed activity-based costing drivers with 28 cost pools mapped to retail and commercial activities. Allocations run monthly via TurboIntegrator with full audit trail — eliminating the 4-year-old static allocation tables
- Retail bank profitability model calculating contribution margin by branch, by product (checking, savings, mortgage, home equity, credit card, personal loans), and by customer segment (mass market, affluent, high-net-worth) — with automated cost allocations including occupancy, technology, operations, and compliance
- Commercial bank profitability model calculating relationship-level and portfolio-level margins by industry vertical, product type (C&I, CRE, treasury management, trade finance), risk rating, and relationship manager — with integrated capital allocation based on Basel risk weights
- Cost of funds / FTP model replacing the spreadsheet-based system with a matched-maturity transfer pricing engine in TM1. Rate curves update automatically from market data feeds. Product-level FTP charges recalculate across the entire book when curves shift — in minutes, not weeks
- Branch performance dashboards via PAXcel™ delivering monthly profitability scorecards to 1,100 branch managers in Excel — including deposit gathering, loan production, fee income, allocated costs, NIM contribution, and branch-level ROA
Why ProfitCy® Made the Difference
The bank had previously attempted to build a profitability system using a specialized banking analytics vendor. The 14-month project stalled at month 9 when the vendor couldn’t reconcile its allocation outputs back to the general ledger — a non-negotiable requirement for regulatory reporting.
ProfitCy® solved this because the profitability model was built natively on the same IBM Planning Analytics platform where the bank’s financial planning and GL reconciliation already lived:
- Allocation outputs tied directly to GL balances with automated reconciliation checks
- The cost of funds model shared dimensions and hierarchies with the financial planning model — eliminating the “two sets of books” problem
- Relationship pricing calculations used the same customer and product hierarchies as the commercial loan origination data feed
- Branch performance metrics rolled up cleanly to division and enterprise P&L — because it was all one TM1 model
The Results: Measurable Impact in Two Quarters
Relationship Pricing: Real-Time ROE by Deal
Commercial relationship managers now see all-in relationship profitability before pricing a new deal. In the first quarter, the bank repriced 34 relationships that were below the hurdle rate — adding $8.2M in annualized spread income without losing a single client. 12 relationships that couldn’t be repriced profitably were exited, freeing $140M in allocated capital.
Customer/Product Allocations: Monthly, Reconciled, Auditable
The allocation engine runs monthly with full reconciliation to the GL. The 28-cost-pool activity-based model replaced static allocation tables that hadn’t been updated since 2022. The first run revealed that retail banking had been absorbing $22M in annual costs that properly belonged to commercial operations — a finding that fundamentally changed the bank’s view of divisional profitability.
Retail Profitability: Branch × Product × Segment
For the first time, the bank can see contribution margin at the intersection of branch, product, and customer segment. The analysis revealed that 18% of branches were unprofitable at the fully allocated level — but 60% of those were profitable when high-net-worth segment customers were properly attributed. This insight changed the branch consolidation strategy from closing 40 branches to repositioning 24 as wealth-focused centers.
Commercial Profitability: Relationship-Level Visibility
The commercial bank can now rank every relationship by risk-adjusted return. The bottom quartile (142 relationships) consumed 31% of allocated capital but generated only 8% of risk-adjusted revenue. The portfolio optimization program is projected to improve commercial banking ROE by 180 basis points over 18 months.
Cost of Funds: Minutes, Not Weeks
When the Fed moved rates, the entire FTP model recalculated across all products and all branches in 12 minutes. Previously, the same update took one analyst 2 weeks. The matched-maturity curves now update automatically from market data feeds via TurboIntegrator.
Branch Performance: 1,100 Monthly Scorecards
Branch managers receive monthly profitability scorecards via PAXcel™ in Excel — with deposit gathering performance, loan production, fee income, allocated costs, NIM contribution, and branch-level ROA. Regional managers can drill from region to branch to product to customer segment in a single view.
The Client’s Perspective
“ForQuest gave us something no other vendor could — a profitability model that reconciles back to the GL, handles both retail and commercial, and lets our relationship managers price deals with real numbers instead of guesswork. We finally know where our money comes from.”
— Chief Financial Officer
Technology Stack
- Platform: IBM Planning Analytics (TM1)
- Planning Model: ProfitCy® Profitability Planning (Relationship Pricing, Customer/Product Allocations, FTP, Branch Performance)
- Excel Connectivity: PAXcel™ Web Add-In
- Data Integration: TurboIntegrator (core banking, GL, loan origination, market data, CRM)
- Dashboards: Planning Analytics Workspace (PAW)
- Implementation Timeline: 16 weeks
Can You Tell Which Customers and Products Are Profitable?
If your bank can’t measure profitability at the customer, product, and branch level with allocations that reconcile to the GL, ForQuest can help. ProfitCy® Profitability Planning deploys in 90 days with pre-built models designed for banking and financial services.