
Rolling Forecasts IBM Planning Analytics teams can implement today solve a persistent FP&A problem — most organizations still operate on an annual budget that’s outdated by March. Rolling Forecasts IBM Planning Analytics teams build around one principle: a rolling forecast maintains a forward-looking view that always extends 12 to 18 months from the current period, and if you’re on the platform, you already have every capability you need. What’s usually missing is the model structure and process design.
This guide walks through how to set up a rolling forecast in IBM Planning Analytics: version architecture, month-end automation, and the current period control that makes the whole system work.
What Rolling Forecasts IBM Planning Analytics Customers Actually Build
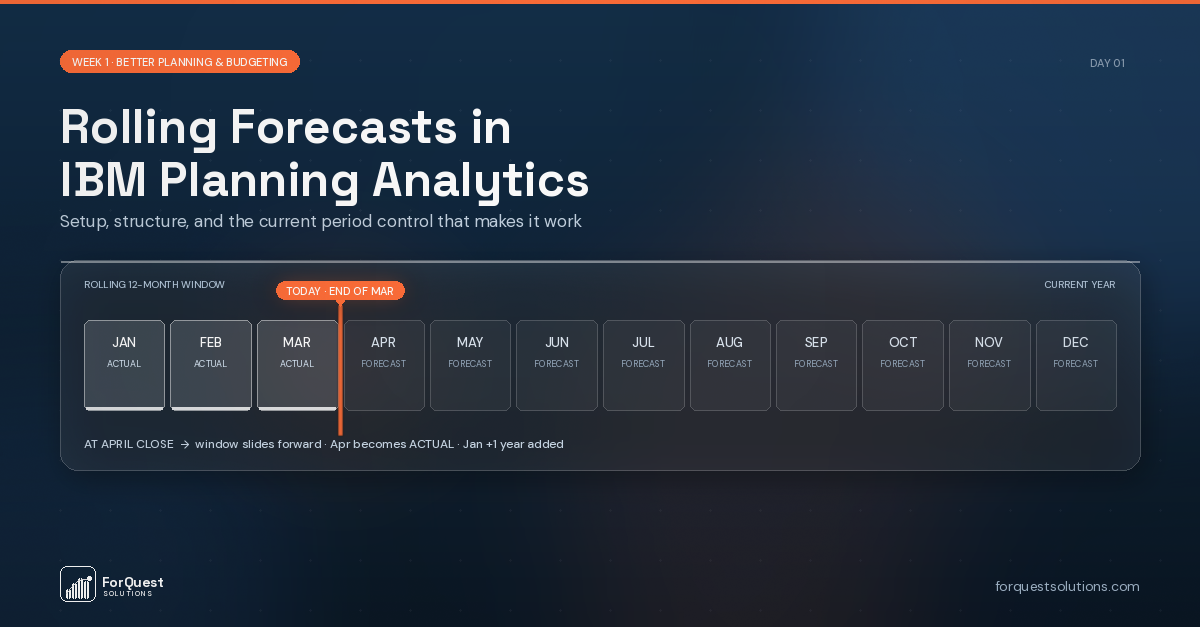
Rolling Forecasts IBM Planning Analytics teams build around one principle: a rolling forecast maintains a forward-looking view that always extends 12 to 18 months from the current period. Each month, actuals are locked for the period just closed, the next few periods are refreshed based on what you now know, and a new forward period opens on the far end. The horizon rolls forward automatically.
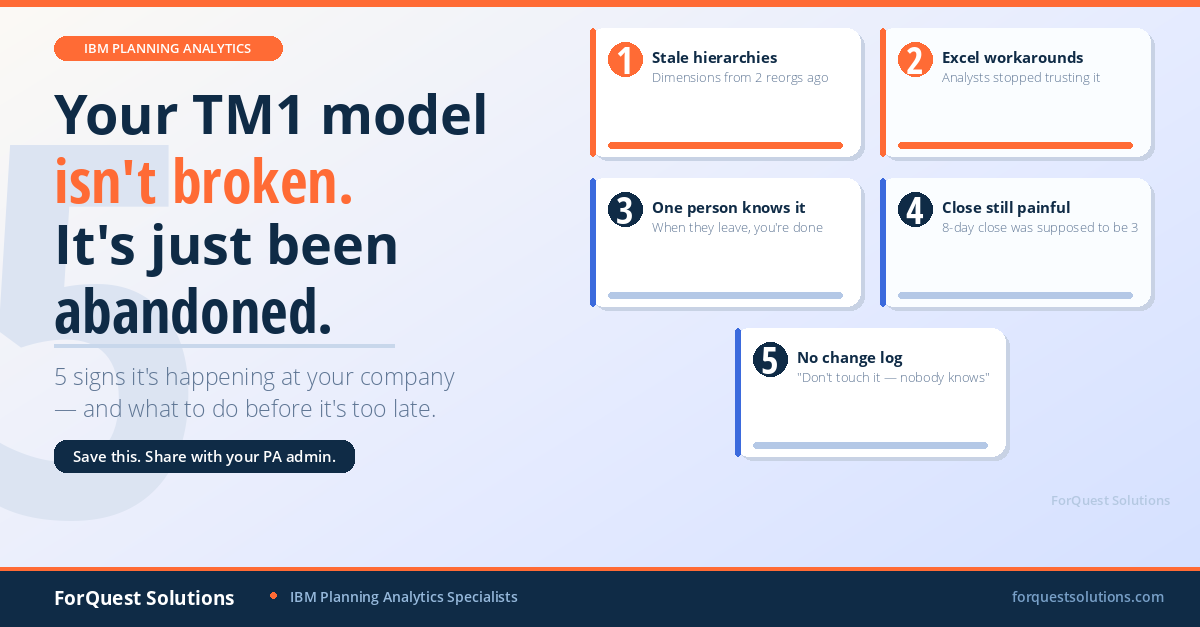
This contrasts with a static annual budget, which is built once per year and progressively becomes stale as the fiscal year unfolds. Research from the FP&A Trends Group consistently shows that organizations running rolling forecasts have more accurate forward views and make faster decisions than those relying solely on annual budgets.
The Version Structure
Three versions working together form the foundation:
Actuals — Locked, loaded from your ERP via TurboIntegrator on a schedule. These never change once a period is closed.
Rolling Forecast — Always editable for the forward 12 to 18 months. This is what planners interact with.
Prior Forecast — A snapshot of last month’s view, preserved for comparison. This gives you the ability to analyze “how has our view changed since last month” — often more insightful than variance to budget.
Some organizations add a fourth version, Baseline, which captures the original annual plan for reference. Whether this is necessary depends on whether leadership references the original plan later in the year.
The Month-End Process
A TurboIntegrator process runs at close each month and does three things:
- Copies the current Rolling Forecast into Prior Forecast. This preserves the “last month’s view” snapshot before anything changes.
- Locks the newly-closed month so planners can’t modify it.
- Opens a new forward period for input (if you’re maintaining an 18-month horizon, April’s close opens September of the following year).
The process is typically 30-50 lines of TI code. It runs in a chore on the first business day of each month, triggered after actuals have loaded.
The Current Period Control
The most elegant part of a rolling forecast design is a small control cube that stores the current open period as a single value. All your PAW input templates and reports reference this cube dynamically.
When the month-end TI process runs and updates the control cube, every view and template shifts automatically. Period selectors always show current. Locked period logic always points to the right months. No manual updates anywhere in the environment.
The control cube typically has dimensions:
- System Control (a dimension with elements like “Current Period”, “Current Year”, “Current Forecast Version”)
- Measure (just “Value”)
One cube. Half a dozen values. Drives consistency across every user-facing view in the environment.
What Changes for the Business
The impact on FP&A work is meaningful:
Variance analysis becomes more useful. “Actual vs. Last Month’s Forecast” tells you whether your forward view is improving. “Actual vs. Budget set 11 months ago” mostly tells you that the world has changed since October.
Planning conversations become forward-looking. Instead of defending a budget built a year ago, your team is updating assumptions based on what’s happening now and what’s expected.
Month-end compresses. Forecasts aren’t rebuilt from scratch each cycle. Planners update changed assumptions and let the model do the math. A process that used to take two weeks can run in three days.
Implementation Considerations
Rolling forecasts work best when combined with driver-based planning. If your model already uses business drivers (headcount, volume, rates) to calculate expenses, updating the forecast means adjusting drivers — not entering thousands of individual line items.
Executive reporting shifts too. Dashboards show forward 12 months by default rather than full year to date + remaining quarter. Cash forecasts reflect the current rolling view rather than stale annual numbers.
Governance matters. Someone owns each version. Actuals are loaded automatically. Rolling Forecast is updated by planners. Prior Forecast updates via the month-end TI process. Clear ownership prevents version drift.
Getting Started
Rolling forecast setup doesn’t require rebuilding your model. For most existing Planning Analytics environments, the work involves:
- Adding the three versions (or renaming existing versions if appropriate)
- Building or adapting the month-end TI process
- Creating the current period control cube
- Updating PAW views to reference the control cube dynamically
- Training planners on the new process
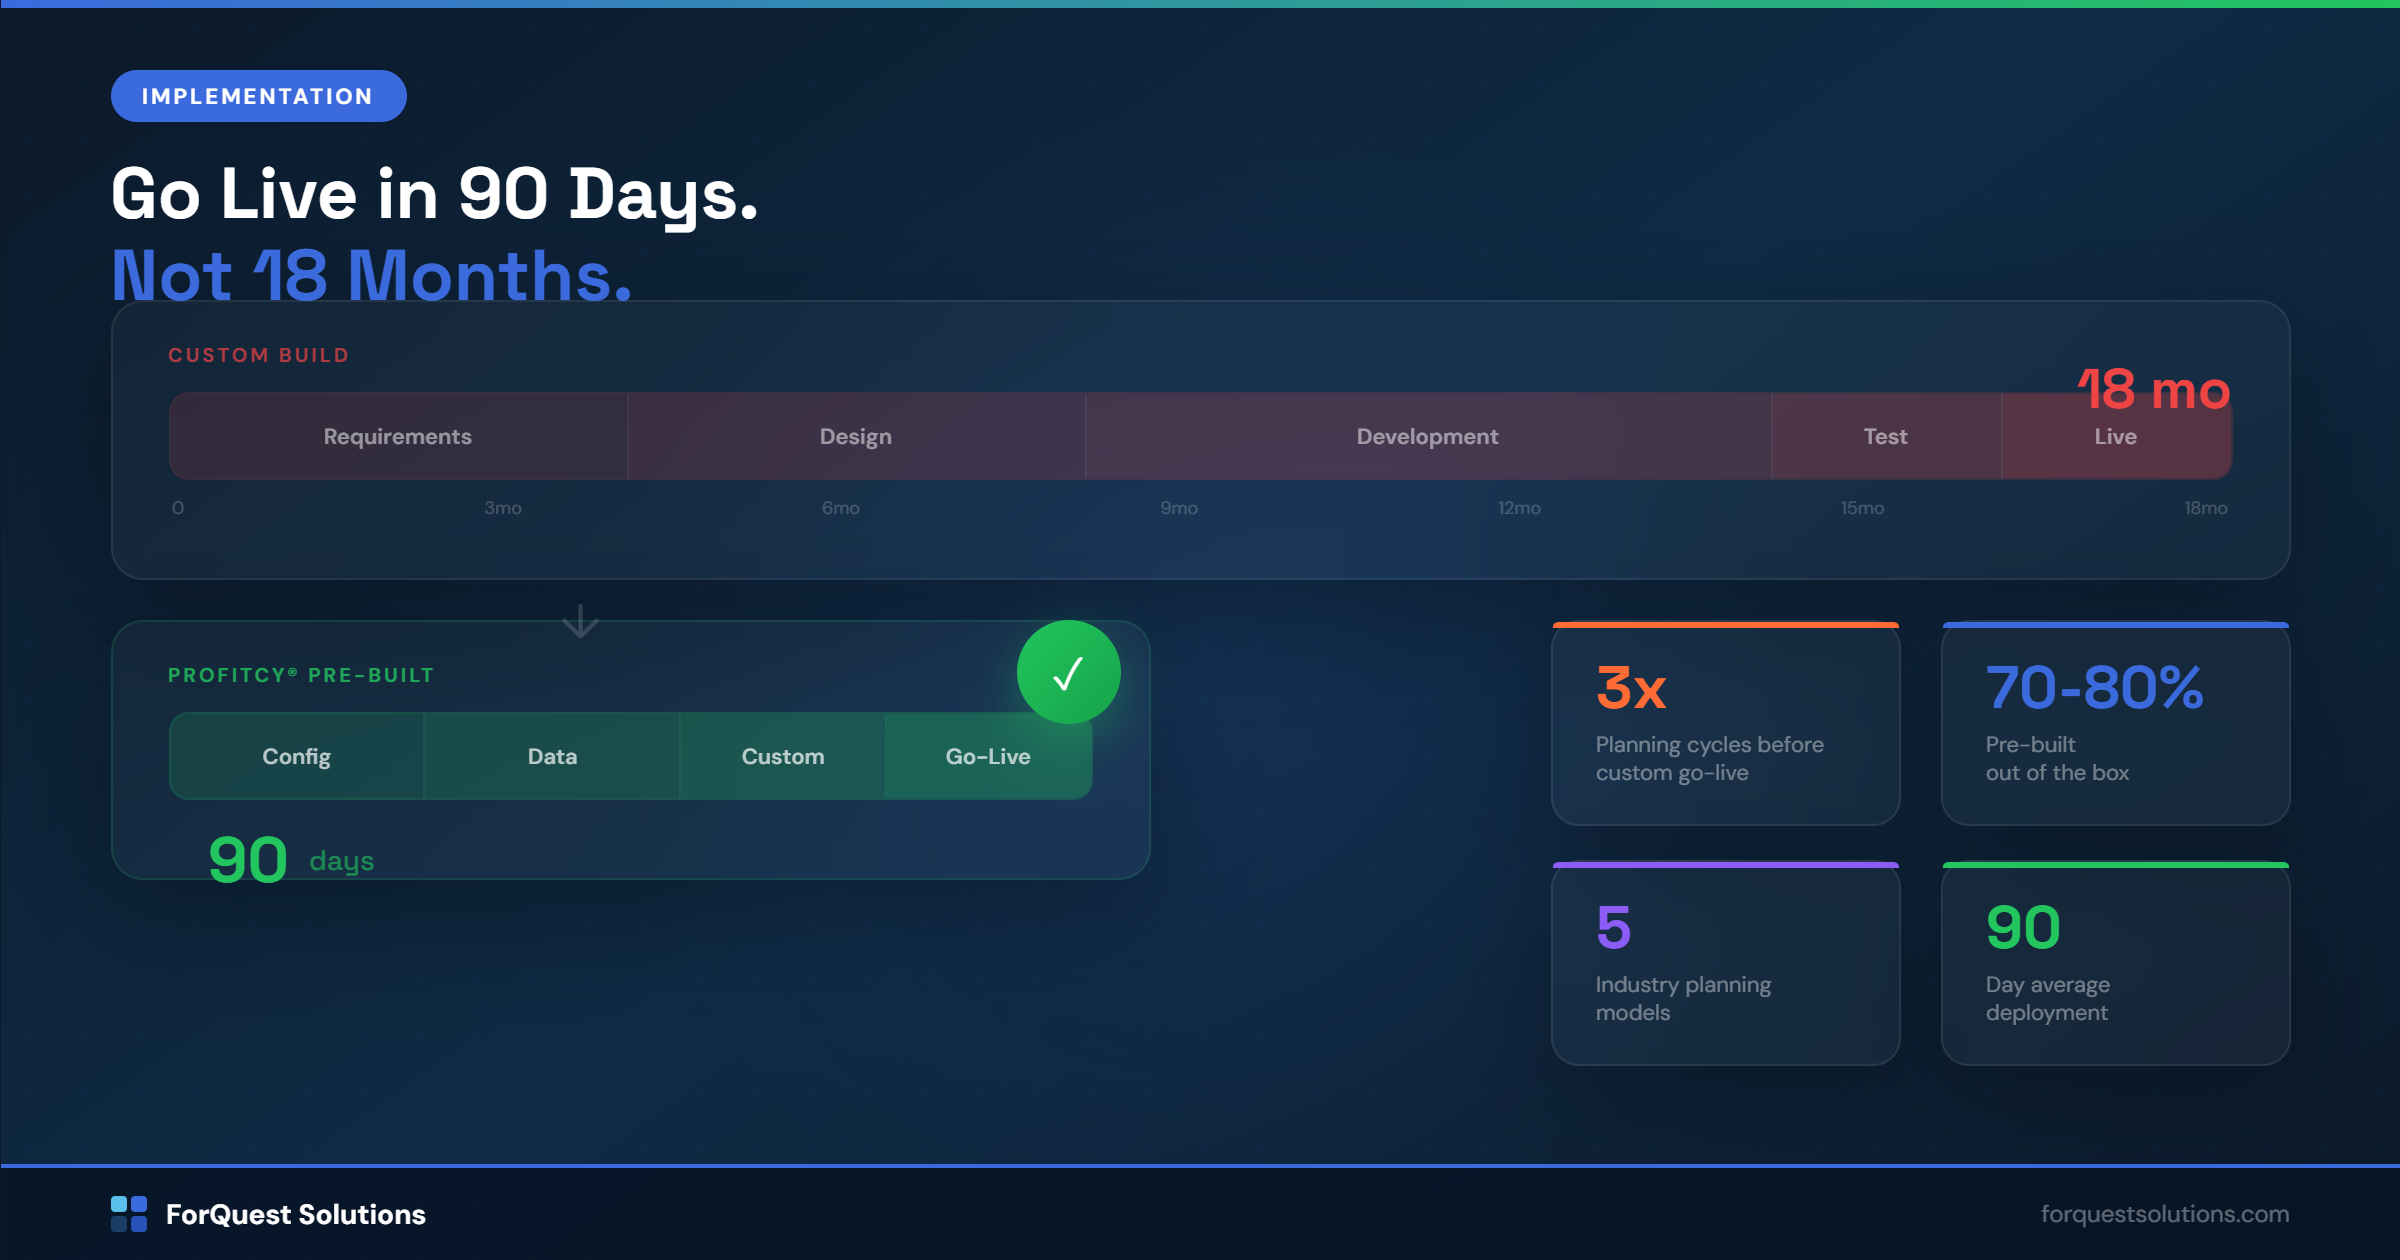
Typical implementation: 3-6 weeks. Rolling Forecasts IBM Planning Analytics implementations are primarily process work. The technical work is modest. The process change — getting planners comfortable updating forecasts monthly rather than annually — is where most of the effort goes.
ForQuest Solutions specializes in IBM Planning Analytics model design and optimization. If your team is considering rolling forecasts or wants to get more from your existing PA environment, we’d welcome a conversation.