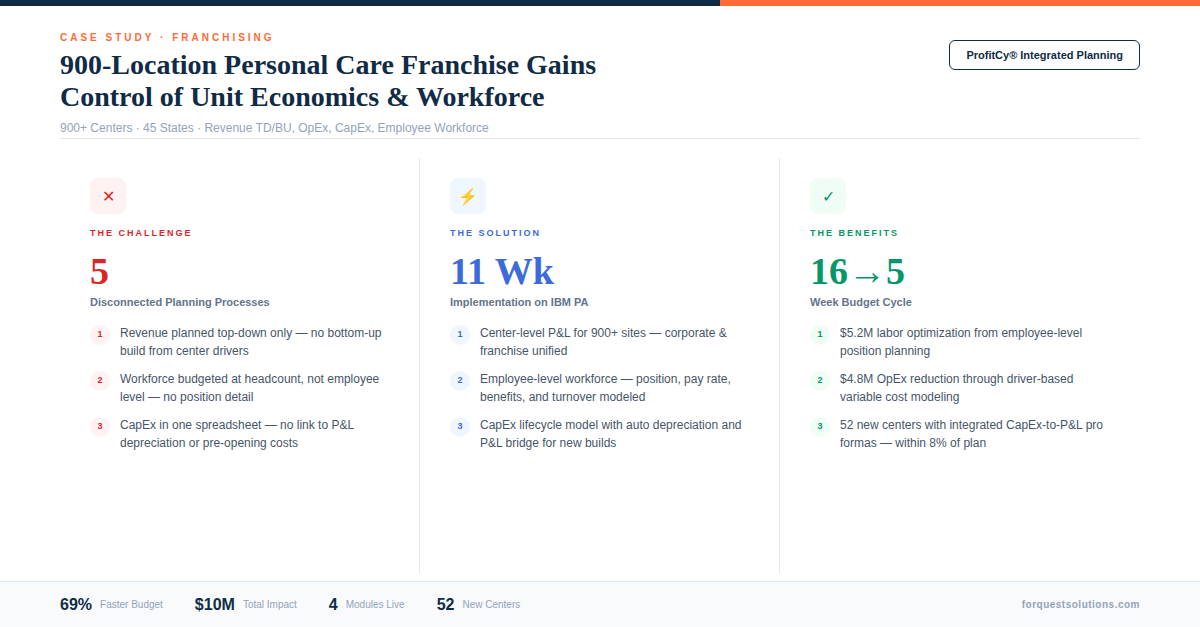

How a national personal care franchise with 900+ centers built a fully integrated planning model — top-down/bottom-up revenue, operating expenses, capital expenditures, and employee-level workforce — in a single IBM Planning Analytics environment.
The Client
A national personal care franchise operating 900+ centers across 45 states, specializing in a single high-frequency personal care service. The company manages a mix of corporate-owned and franchise locations, with corporate finance responsible for enterprise-wide budgeting, forecasting, and capital allocation. The business model depends on membership-driven recurring revenue, guest frequency, and service provider productivity.
The Challenge: Five Planning Processes, Zero Integration
The company didn’t have one planning problem — it had five. Revenue, operating expenses, capital expenditures, workforce, and new center economics were each planned in separate spreadsheets by different teams using different assumptions. Nothing connected.
- Revenue planned top-down only — corporate set annual revenue targets by region using blended growth rates. Center managers had no input and no ownership of the targets. There was no bottom-up build from guest traffic × service mix × pricing × membership conversion that would validate whether top-down targets were achievable
- Operating expenses budgeted by line item, not by driver — center-level OpEx budgets were built by inflating last year’s actuals by 3-5%. Nobody modeled the relationship between guest volume and variable costs (supplies, utilities, laundry) or between headcount and semi-variable costs (training, scheduling overhead)
- Capital expenditures tracked in a single spreadsheet — the VP of Real Estate maintained one master Excel file with 900+ rows for center refreshes, new builds, technology upgrades, and equipment replacements. Approval workflows happened via email. There was no integration between CapEx decisions and their impact on the operating P&L (depreciation, occupancy, pre-opening costs)
- Workforce planned at headcount level, not employee level — HR budgeted “45 FTEs for Southeast Region” without modeling which positions, at what pay rates, with what benefits loading, and in which centers. When a center needed to hire, the approved budget didn’t specify whether the role was a licensed service provider at $22/hour or a front desk associate at $15/hour
- New center economics disconnected from everything — the development team built pro formas for new centers in standalone spreadsheets with assumptions that didn’t match the operating model. A new center’s “Year 1 revenue” used one methodology while the financial plan used another. Post-opening, nobody reconciled projected vs. actual performance
The CFO told the board: “I have five teams building five plans that don’t add up to the same number. I can’t tell you whether we can afford to open 50 new centers next year because our revenue plan, our cost plan, our CapEx plan, and our hiring plan all live in different spreadsheets.”
The Solution: ProfitCy® Integrated Planning on IBM Planning Analytics
ForQuest deployed ProfitCy® with four integrated modules — Revenue Planning, Operating Expense Planning, Capital Expenditure Planning, and Workforce Planning — on IBM Planning Analytics. The design principle: every module shares the same center × period × scenario dimensions so that a change in any module immediately flows through to the consolidated P&L and cash flow.
The implementation took 13 weeks from kickoff to production.
What ForQuest built:
Revenue Planning — Top-Down/Bottom-Up with Reconciliation
- Top-down targets set by the CFO at region and territory level based on same-center growth, new center openings, and pricing strategy
- Bottom-up build by center from guest traffic drivers: active members × visit frequency × revenue per visit, plus walk-in traffic × conversion rate × average ticket. Service mix (core service, premium service, retail product) modeled separately
- Automated gap analysis comparing top-down targets to bottom-up builds with variance waterfall by center. Regional directors reconcile gaps before the plan is finalized — eliminating the disconnect between what corporate expects and what centers can deliver
- Membership revenue model tracking active members, new enrollments, churn, downgrades, and upgrades by tier — flowing membership economics directly into the revenue forecast
Operating Expense Planning — Driver-Based by Center
- Variable costs modeled as a function of guest volume: supplies per visit, laundry cost per visit, utilities scaled to operating hours, credit card processing as % of revenue
- Semi-variable costs modeled by headcount and center characteristics: training cost per new hire, scheduling system cost per employee, insurance per location
- Fixed costs planned at the center level: rent, CAM charges, property tax, base technology fees — with lease escalation schedules imported from the real estate management system
- Corporate overhead allocation using activity-based drivers mapped to center-level metrics (revenue, headcount, square footage) — with full transparency into what each center absorbs
Capital Expenditure Planning — Lifecycle-Based
- Center refresh model with equipment lifecycle tracking: waxing beds, HVAC, signage, flooring, technology — each with a useful life, replacement cost, and depreciation schedule. The model flags centers approaching refresh thresholds and projects CapEx requirements 5 years forward
- New center build model with standardized build-out costs by center format (inline, endcap, freestanding) and market tier — automatically creating the pre-opening cost schedule, depreciation impact, and first-year P&L drag for each approved location
- Technology CapEx for POS upgrades, scheduling system migrations, and kiosk deployments — planned at the initiative level with project timelines and phased spending
- CapEx-to-P&L bridge that automatically flows depreciation, amortization, and pre-opening costs from the CapEx plan into the operating P&L — so every capital decision’s P&L impact is visible immediately
Workforce Planning — Employee-Level
- Position-level planning for every center: each budgeted role has a position title, pay rate, hours per week, benefits loading percentage, payroll tax rate, and start date. Center managers don’t budget “5 FTEs” — they budget “2 licensed estheticians at $23/hr, 2 front desk associates at $15/hr, and 1 center manager at $52K salary”
- Appointment-driven scheduling optimization using historical guest traffic by day-of-week and hour to generate optimal staffing templates. The model identifies centers that are overstaffed during troughs and understaffed during peaks
- Benefits and burden calculation at the employee level — medical, dental, vision, 401(k) match, PTO accrual, workers’ comp, and employer payroll taxes. Each component is modeled with plan-specific rates and eligibility rules (full-time vs. part-time thresholds)
- Turnover and vacancy modeling with historical turnover rates by position and center vintage. The model budgets recruitment costs, training investment, and productivity ramp for expected replacements — not just steady-state headcount
- Compensation scenario modeling for minimum wage changes, merit increase pools, and benefits plan redesigns — showing the total cost impact across the entire 900-center network instantly
PAXcel™ Reports
- CFO: Consolidated P&L with drill from enterprise → region → territory → center, with full CapEx-to-P&L bridge and workforce cost detail
- Regional Directors: Center scorecards with revenue vs. plan, OpEx efficiency, staffing metrics, and CapEx status
- Center Managers: Their center’s P&L with guest metrics, labor efficiency, and revenue per visit trends
- VP Real Estate: CapEx pipeline, refresh schedule, and new center pro forma tracker
- HR: Employee-level workforce budget by center with position detail, vacancy rates, and compensation benchmarks
Why ProfitCy® Made the Difference
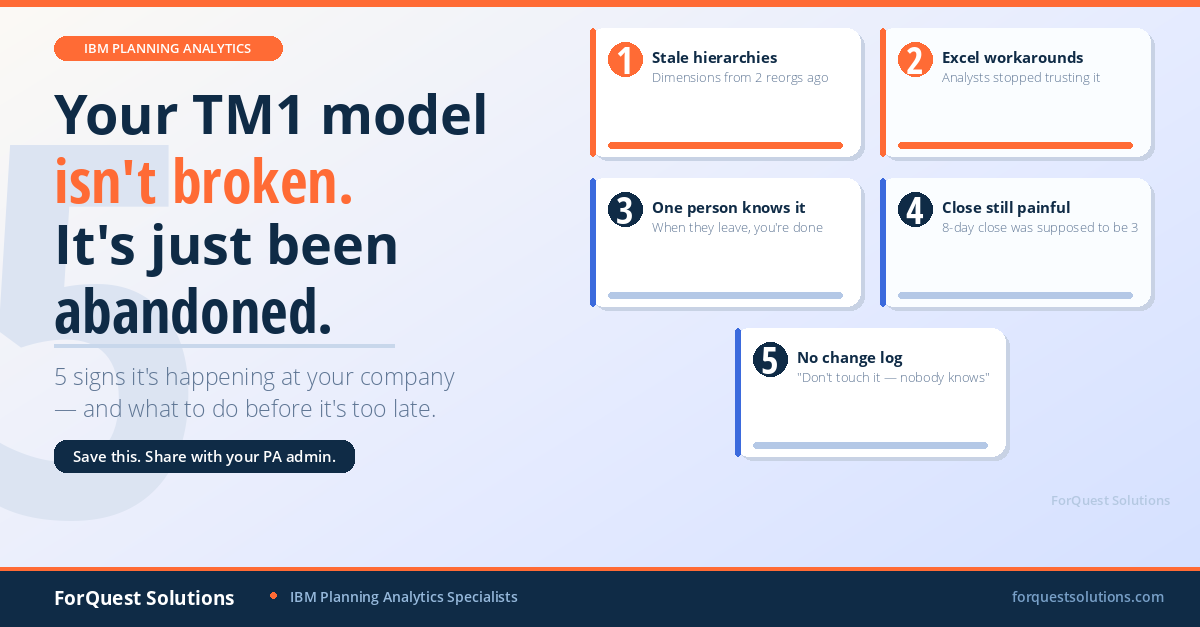
The company had tried twice before to centralize planning — once with a major ERP vendor’s planning module (abandoned after 8 months because it couldn’t handle center-level granularity at 900 entities) and once with a mid-market CPM tool (abandoned because employee-level workforce planning exceeded the tool’s row limits).
ProfitCy® on IBM Planning Analytics handled this because:
- TM1’s in-memory architecture processes 900 centers × 12 months × 4 scenarios × thousands of employees without performance issues
- The pre-built module architecture (revenue, OpEx, CapEx, workforce) was designed to share dimensions — so integration was structural, not bolted on
- Employee-level data fit naturally into TM1’s sparse cube architecture — only populated positions consume memory
- The top-down/bottom-up reconciliation workflow was pre-built with gap analysis and approval routing
The Results: Measurable Impact in Two Quarters
16 Weeks → 5 Weeks: Annual Plan Cycle
All four planning modules run concurrently in the same model. Revenue targets, OpEx budgets, CapEx requests, and workforce plans are built simultaneously with real-time visibility into the consolidated P&L impact. The plan is board-approved by early October instead of mid-November.
Top-Down/Bottom-Up Gap: Visible and Resolved
The first bottom-up build revealed a $34M revenue gap versus top-down targets. The gap analysis showed it was concentrated in 120 centers with membership churn above 8%. The growth plan was adjusted with targeted retention programs instead of unrealistic revenue targets — and the plan was achievable for the first time.
$4.8M OpEx Reduction Through Driver-Based Budgeting
Moving from “last year + 3%” to driver-based variable cost modeling exposed $4.8M in operating expense that wasn’t justified by guest volumes. 85 centers were spending 15-22% above the driver-based benchmark for supplies and laundry costs. Corrective action was taken within one quarter.
CapEx Visibility: $28M Pipeline with P&L Impact
The CFO can now see the full $28M CapEx pipeline — 38 center refreshes, 52 new builds, and 6 technology initiatives — with the depreciation and pre-opening cost impact automatically reflected in the operating P&L forecast. The board approved the capital plan 4 weeks faster because the financial impact was already modeled.
Employee-Level Workforce: $5.2M Labor Optimization
Position-level planning revealed that 140 centers had labor budgets built at average rates rather than actual position rates. Correcting this exposed $3.1M in over-budgeted labor. Appointment-driven scheduling optimization identified another $2.1M in savings by shifting hours from trough periods to peak periods — improving both cost efficiency and guest experience.
New Center Accuracy: Plan-to-Actual Within 8%
The first 52 new centers opened using integrated pro formas from the ProfitCy® model hit within 8% of planned Year 1 revenue — compared to 25-35% variance using the old standalone spreadsheets. CapEx actuals were within 5% of plan because the standardized build-out templates eliminated estimating variance.
The Client’s Perspective
“For the first time, I can see the full picture — revenue, costs, CapEx, and every employee — in one model that adds up. When the board asks ‘can we afford 50 new centers next year?’ I don’t need 3 weeks and 4 teams to answer. I show them the model.”
— Chief Financial Officer
Technology Stack
- Platform: IBM Planning Analytics (TM1)
- Planning Model: ProfitCy® Revenue Planning, Operating Expense Planning, Capital Expenditure Planning, Workforce Planning
- Excel Connectivity: PAXcel™ Web Add-In
- Data Integration: TurboIntegrator (POS, HRIS/payroll, lease management, scheduling system, franchise reporting)
- Dashboards: Planning Analytics Workspace (PAW)
- Implementation Timeline: 13 weeks
Running Revenue, OpEx, CapEx, and Workforce in Separate Spreadsheets?
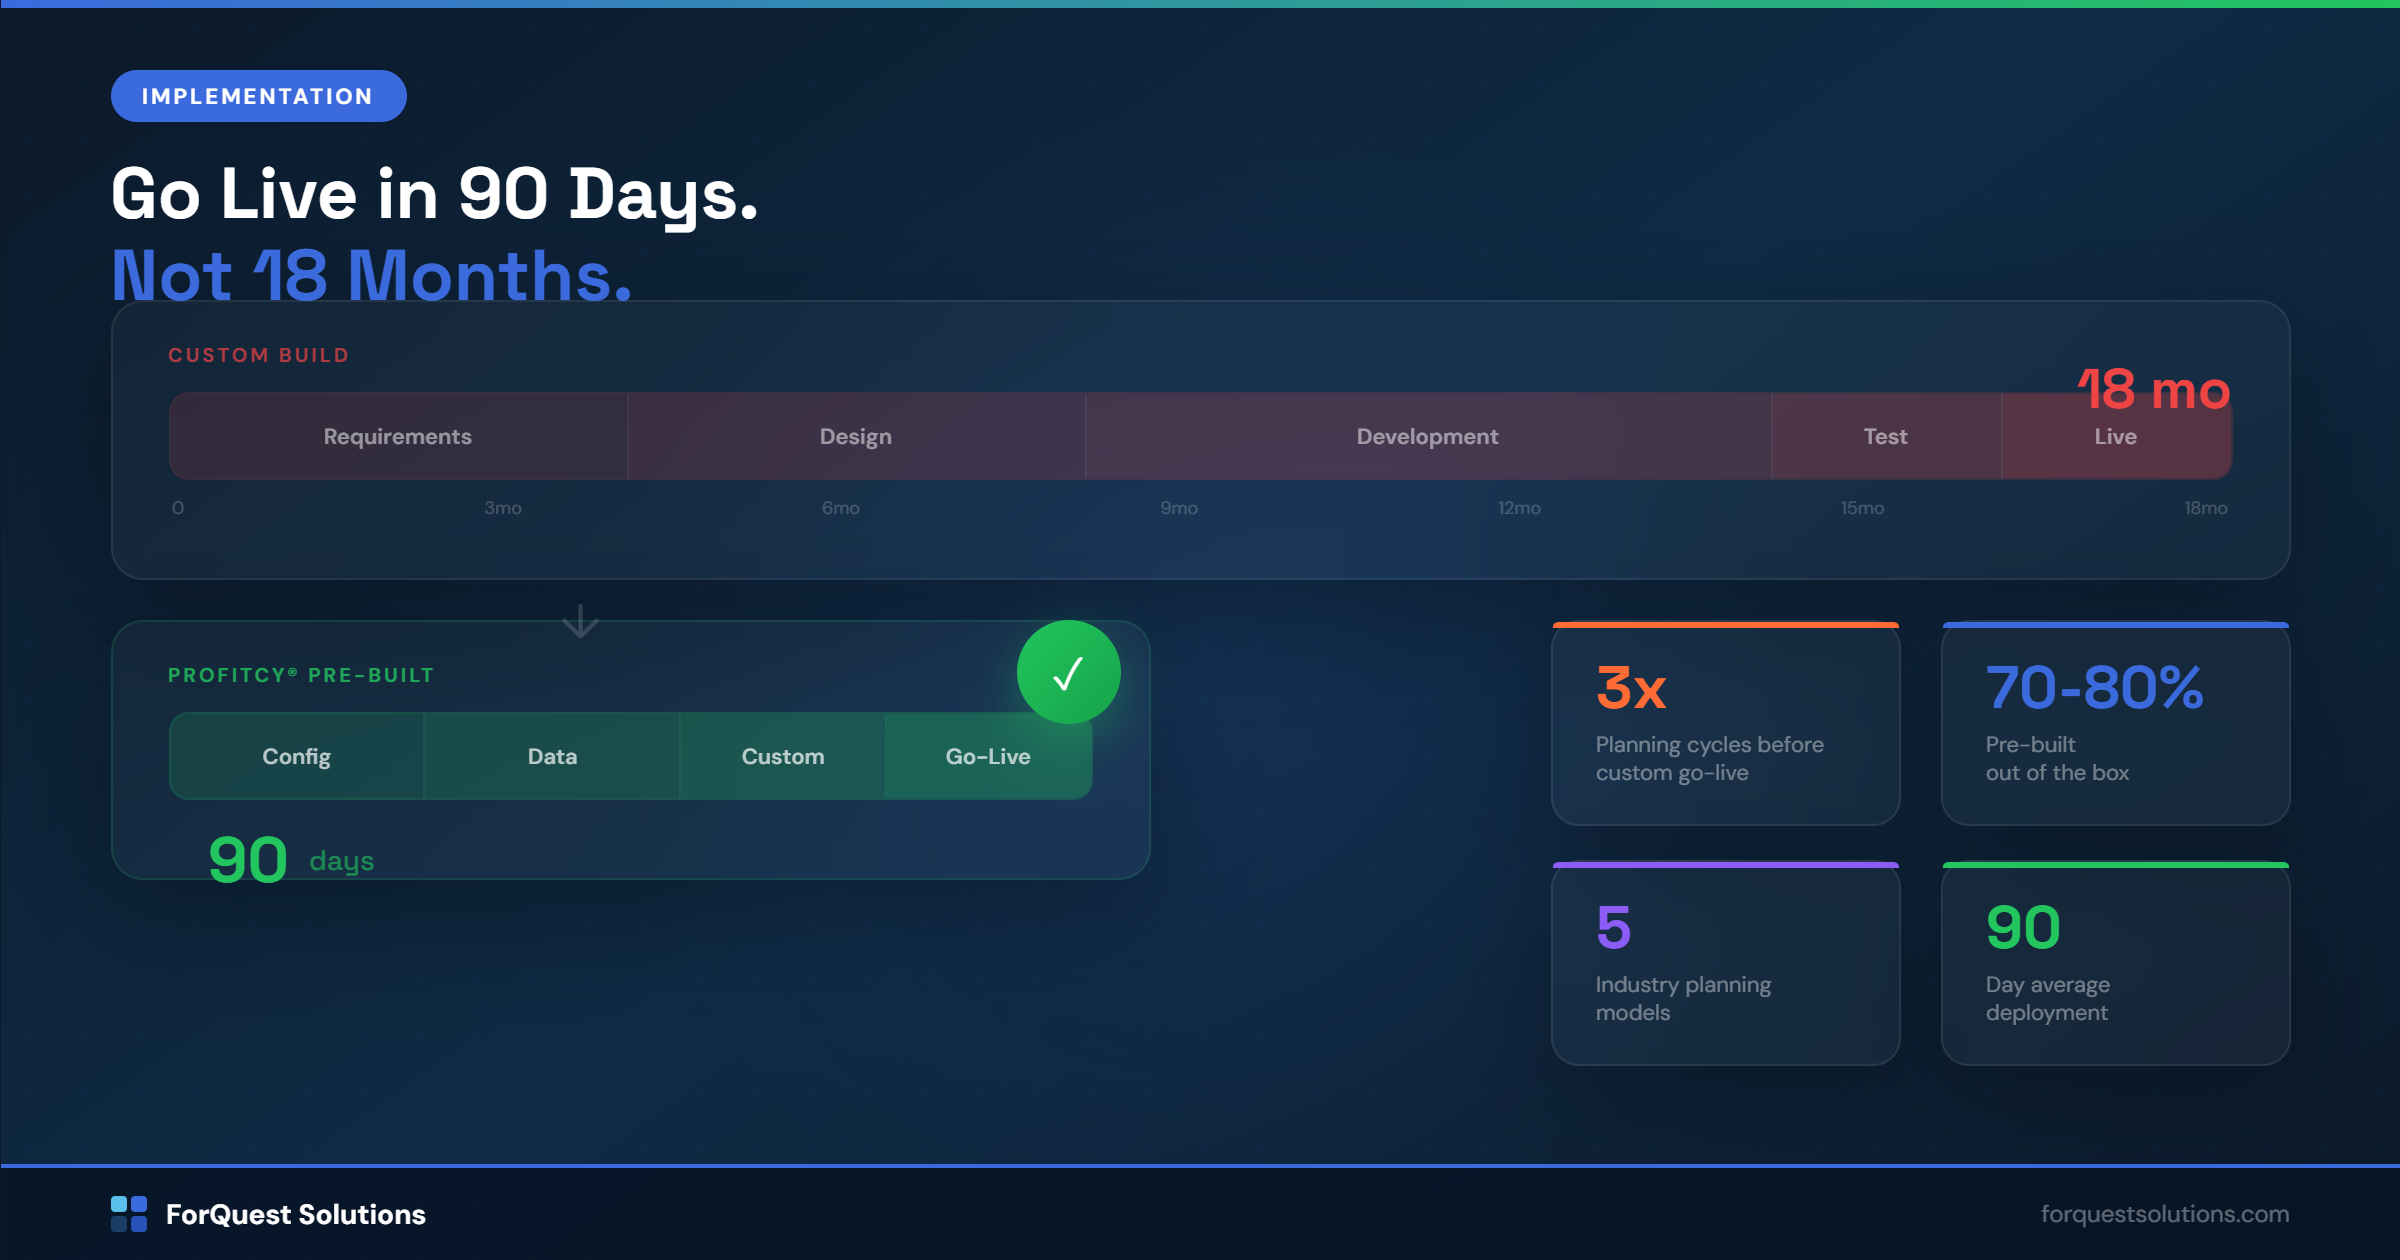
If your franchise or multi-location business can’t see the full financial picture in one model, ForQuest can help. ProfitCy® integrates revenue, operating expense, capital expenditure, and employee-level workforce planning on IBM Planning Analytics — deployable in 90 days.